
Have you ever looked at htop, seen your CPU at 50%, but noticed your application is still crawling? In his book System Performance, Brendan Gregg highlights a critical reality: Standard CPU profiling only tells half the story.
To truly understand performance, we must distinguish between when our code is “On-CPU” (doing work) and when it is “Off-CPU” (waiting in the shadows).
The Laboratory: A Hybrid Rust Workload #
To prove the “invisible” nature of performance, we created a Rust program designed to spend exactly half its time working and half its time sleeping.
use std::thread;
use std::time::{Duration, Instant};
use std::hint::black_box;

fn on_cpu_work(duration: Duration) {
    let start = Instant::now();
    // Busy-loop: Keeps the CPU core 100% active
    while start.elapsed() < duration {
        black_box(1.0 / 3.14159);
    }
}

fn off_cpu_work(duration: Duration) {
    // Context Switch: Leaves the CPU to wait
    thread::sleep(duration);
}

fn main() {
    println!("Starting Hybrid Workload (PID: {})...", std::process::id());
    loop {
        on_cpu_work(Duration::from_millis(500));
        off_cpu_work(Duration::from_millis(500));
    }
}
Part 1: On-CPU Analysis (The “Photographer”) #
Standard profiling is timer-based sampling. It’s like a photographer taking snapshots of the CPU at regular intervals.
The 99Hz Trick #
We use 99Hz instead of 100Hz to avoid Lock-step Sampling. If your app has a 100Hz “heartbeat” and your profiler also runs at 100Hz, you might accidentally sync up with the work or the gaps, leading to skewed data. 99Hz ensures we mathematically “drift” across the activity.
The Command #
sudo perf record -F 99 -g -p $(pgrep cpu_profile) -- sleep 10The Report #
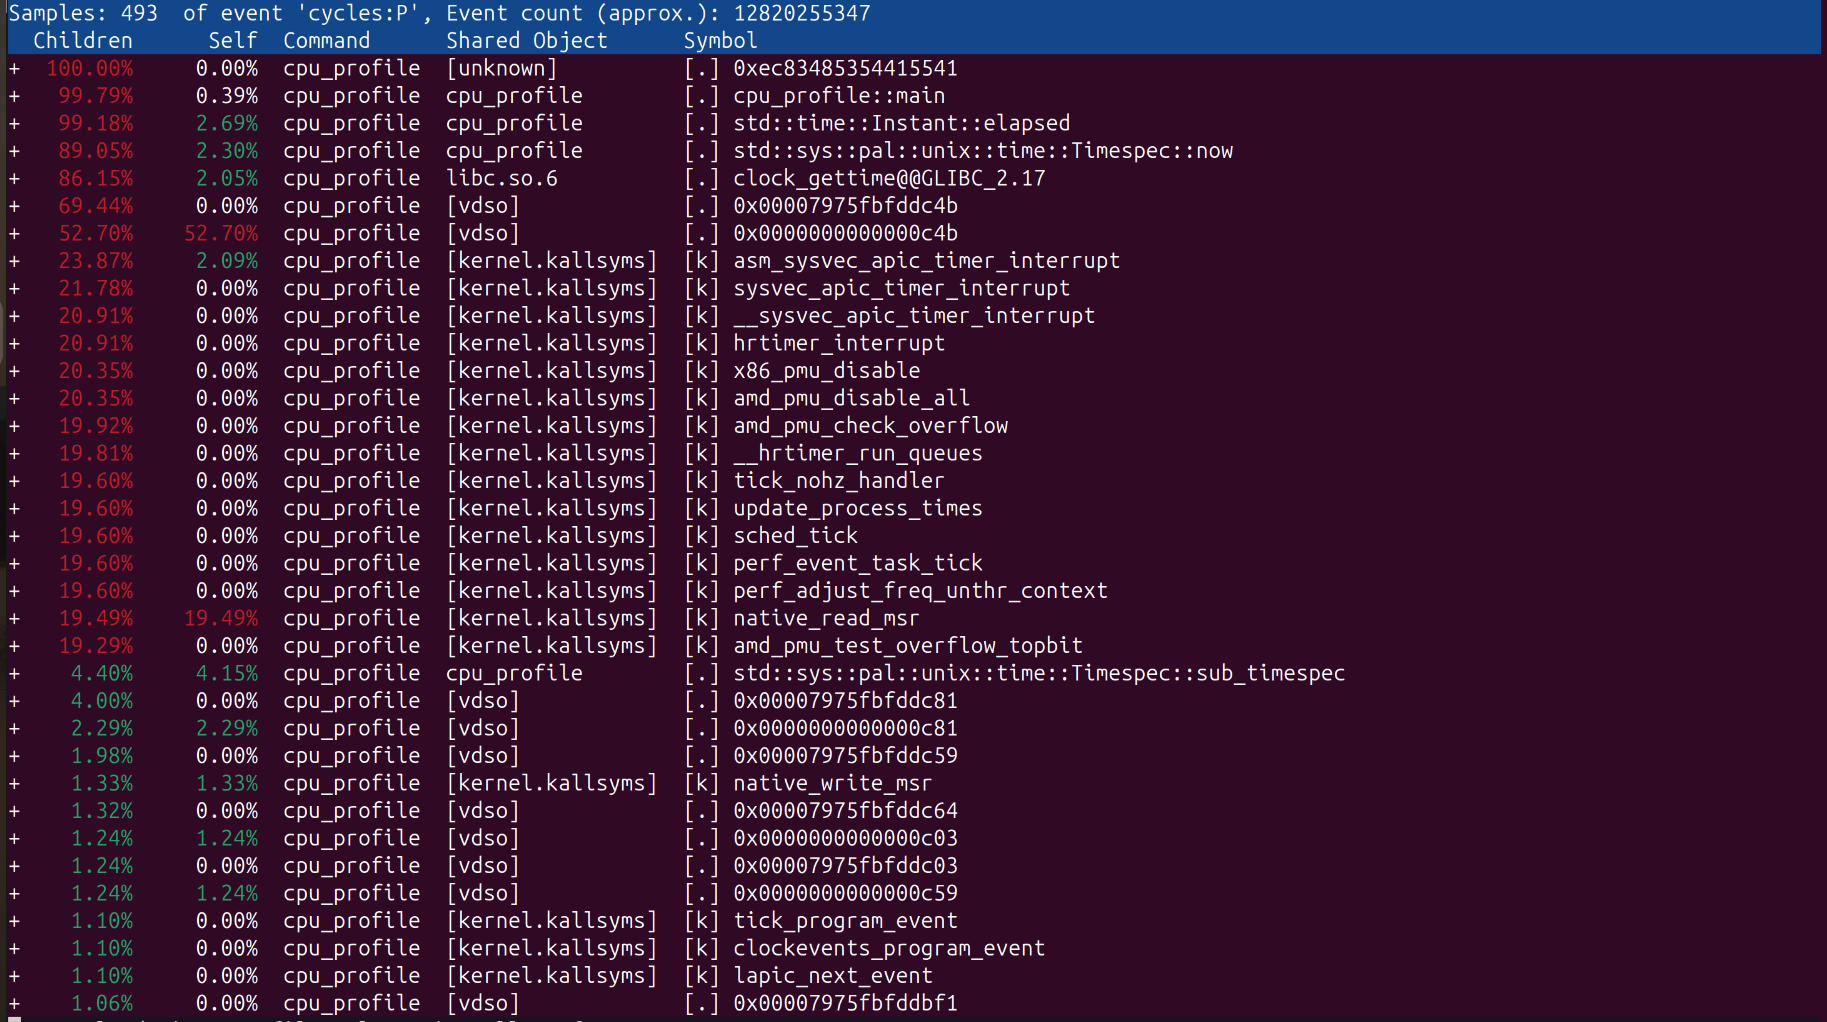
Analyzing the Report #
When you run perf report, you’ll see a hierarchy of where cycles were spent.
| Column | Meaning |
|---|---|
| Children | Total time in this function + everything it called. |
| Self | Time spent strictly in this function (The “Bottleneck”). |
| Shared Object | Where the code lives (Kernel, libc, or your binary). |
Part 2: Off-CPU Analysis (The “Detective”) #
To see the “Grey Lines” (the time spent waiting), we must stop sampling and start tracing. We use eBPF to hook into the Linux Scheduler’s sched_switch event.
The Command #
# Using the BCC toolkit to trace waiting time
sudo offcputime-bpfcc -p $(pgrep cpu_profile) 5
The Off-CPU Report #
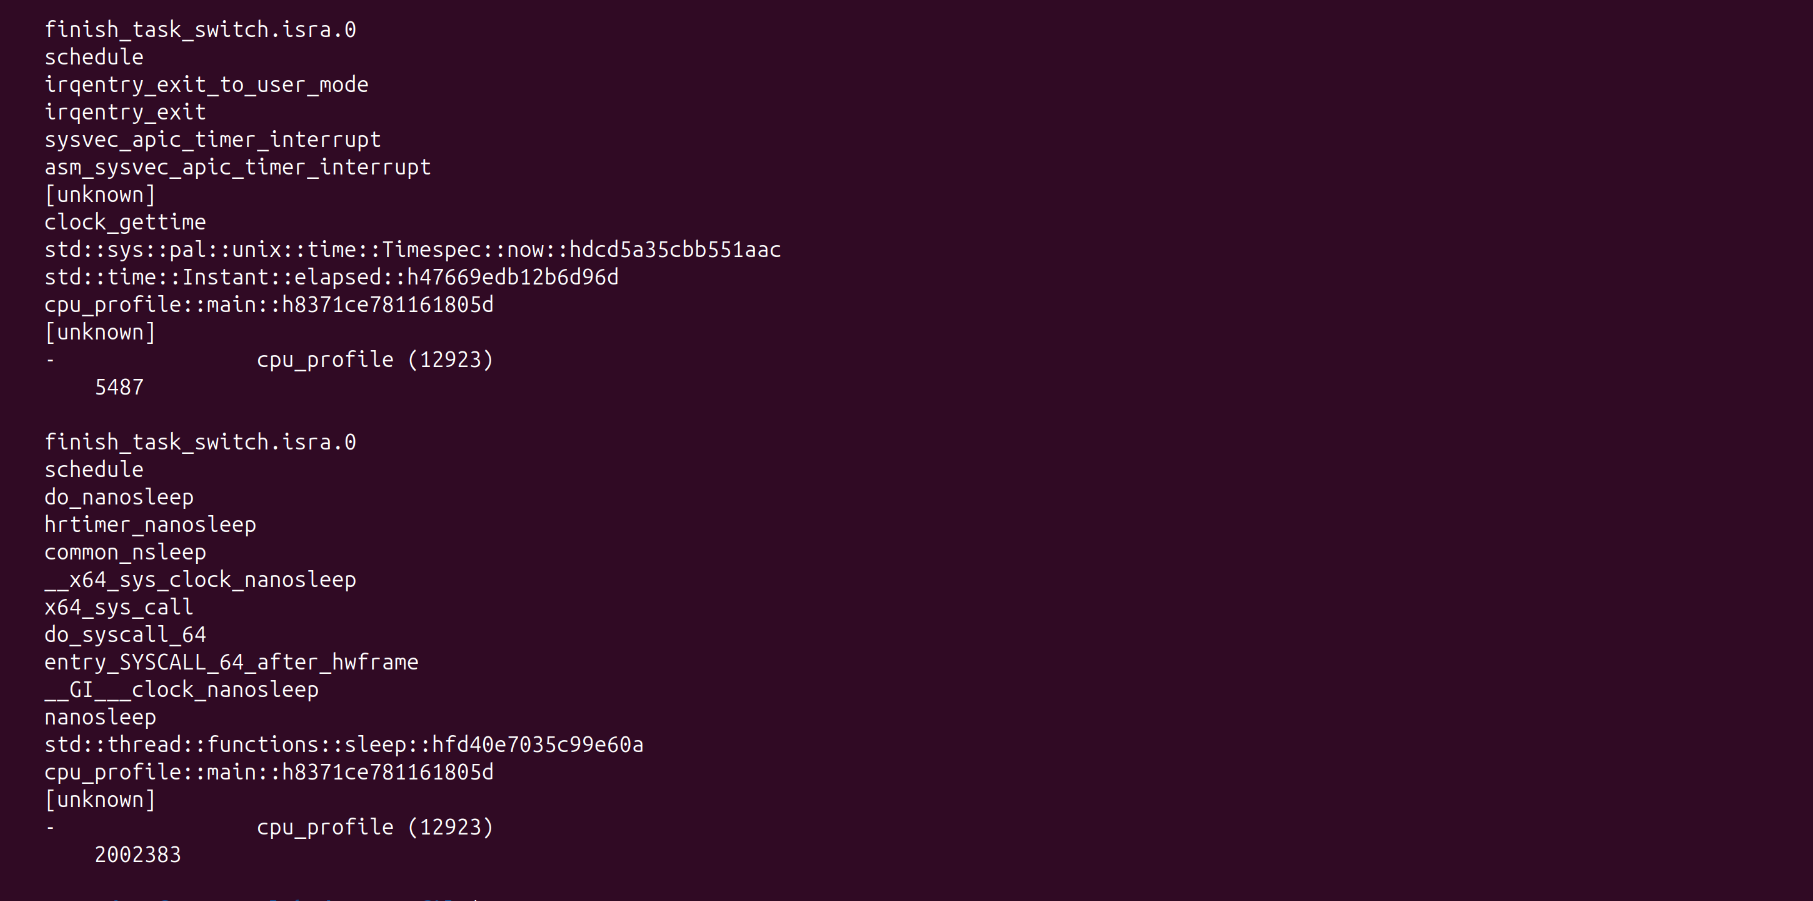
perf only saw the math work, offcputime caught the 2.002 seconds of intentional sleep.
Analyzing the Traces #
Unlike perf, offcputime shows you the stack traces of why your program was NOT running.
- Voluntary Context Switches (VCX): Occur when your code calls
nanosleepor waits for a Mutex. This is your code choosing to wait. - Involuntary Context Switches (ICX): Occur when the kernel kicks your app off the CPU to handle a hardware interrupt or because your “time slice” ran out.
offcputime revealed a massive 2,000,000μs (2s) block. This is the “Invisible Half” that perf could never see—the time spent inside std::thread::sleep.
The Architectural Context: The Linux Scheduler #
Behind every transition from On-CPU to Off-CPU is the Linux Scheduler (CFS/EEVDF).
- Red-Black Tree: Linux stores runnable tasks in a balanced tree to ensure “fairness.”
- vruntime: The scheduler tracks how much time each task has had. The “starved” task on the left of the tree runs next.
- Cache Affinity: The scheduler tries to keep your thread on the same CPU core to keep the caches “warm.” Moving a thread (migration) results in “cold” cache misses, hurting performance.
Conclusion: The Full Picture #
Performance engineering isn’t just about making your math faster. It’s about minimizing the time your threads spend as “Grey Lines” in the scheduler.
- Low IPC + High CPU: Your code is On-CPU but stalled (waiting for RAM).
- Low CPU + Slow App: Your code is Off-CPU (waiting for I/O or Locks).
- High ICX (Involuntary Context Switches): Your system is saturated; threads are fighting for air.
The Golden Rule: Use perf to optimize the Work, and use offcputime to optimize the Wait.
References:
- Gregg, B. (2020). System Performance: Enterprise and the Cloud.